What Is The Most Bike-Friendly City In Canada?
No single Canadian city holds a verified crown for bike-friendliness, because every ranking measures something different. Here is what the verified numbers say about Toronto's cycling network, trails and seasons.
There is no verified single answer. Every published ranking of Canadian cities uses a different method, different years and different measures, so the winner changes with the scoreboard. What is verifiable is specific: Toronto's cycling network stood at 346 km of on-street infrastructure plus 399.3 km of multi-use trails as of December 2025, numbers few North American cities of its size can match.
That distinction matters more than it first appears. A ranking built on commuter mode share rewards dense, older cities where short trips are the norm. A ranking built on kilometres of protected lanes rewards cities that have spent recently and heavily. A ranking built on safety per trip rewards small networks with light traffic. Change the question slightly and the city at the top of the list changes completely, which is why any confident one-word answer to this question should be treated with suspicion.
The honest version of the answer is a story about infrastructure, and Toronto's chapter of that story is unusually well documented. The City publishes its own network status counts, Ontario publishes its cycling law in plain language, and Environment and Climate Change Canada publishes long-run climate normals for the downtown station. Those three sources together describe a city where riding is practical for a large part of the year, on a network that has grown steadily even through a period of political friction over bike lanes.
That friction is part of the record too. In August 2026 the Ontario Court of Appeal ruled unanimously that roadway design is a matter for the legislature rather than the courts, upholding provincial authority over bike lane removals on major Toronto streets. On 30 October 2026 the province completed removing the protected lanes on a 1.2 km stretch of Bloor Street West in Etobicoke. Cycling advocates have announced they will seek leave to appeal to the Supreme Court of Canada. None of this settles whether Toronto is bike-friendly; it does show the question is live enough to fight over in court, which is itself a sign of how much riding now happens in Canadian cities.
The practical takeaway for a visitor is simpler than the politics. Whatever a ranking says, you will experience a city's bike-friendliness through three things: the infrastructure you actually ride on, the rules you ride under, and the weather you ride in. All three are measurable, and all three are covered below with verified figures, plus a way to test the network yourself on a guided ride rather than taking any list's word for it.
What Makes A City Bike-Friendly?
Bike-friendliness is usually judged on four measurable things: kilometres of protected and painted infrastructure, how many trips people actually make by bike, injury rates per trip, and how much of the year the weather permits riding. Rankings weigh these differently, which is why they disagree, and why no single Canadian city holds a verified claim to the title.
Infrastructure is the easiest of the four to count, and it is where Toronto's own published numbers are clearest. As of December 2025 the City reported 110.1 km of cycle tracks, 143.8 km of bicycle lanes, 92.1 km of sharrows, for an on-street total of 346 km, alongside 399.3 km of multi-use trails measured as centreline kilometres. Those are the City's own counts from its network status page, not an advocacy group's estimate, and they describe a network that has been built layer by layer over two decades.
| Infrastructure type | Kilometres (December 2025) | What it is |
|---|---|---|
| Cycle tracks | 110.1 km | Lanes physically separated from motor traffic |
| Bicycle lanes | 143.8 km | Painted dedicated lanes |
| Sharrows | 92.1 km | Shared-lane markings on low-speed streets |
| On-street total | 346 km | Sum of the three above |
| Multi-use trails | 399.3 km | Off-street paths, centreline measure |
Usage is harder to compare fairly between cities because counting methods differ, but Toronto's shared bike system gives a rare public number. Bike Share Toronto's 2026 operating plan projected 8.6 million trips for the year, up about 10 percent from the 7.81 million actually recorded in 2025, with e-bike trips forecast at 1.71 million. Those figures are reported in the plan rather than independently audited, so they are best read as the operator's own projection, but the scale is the point: a city where a public bike system runs millions of trips a year has a riding culture that goes well beyond weekend enthusiasts.
Safety is the measure rankings lean on most and verify least, because per-trip injury data depends on trip counts that no Canadian city measures identically. The honest position is that no verified national comparison exists in the sources behind this article, and any claim that one Canadian city is definitively safer to ride than another should carry the burden of proof. What can be stated is Ontario's legal baseline, which applies to every ride in Toronto: cyclists under 18 must wear an approved helmet, every bike needs a bell or horn, and riding on sidewalks is not allowed, with an exception for children under 10. Those rules shape behaviour more than most visitors expect.
Weather is the fourth measure, and it is the most underrated. A city can build perfect infrastructure and still lose half its riding season to climate. Toronto's ECCC 1991 to 2020 normals put the average daily high at 27.0 C in July and 22.0 C in September, with November averaging 8.1 C and January minus 0.3 C. Roughly 104 days a year see at least 1 mm of precipitation, spread fairly evenly across the months. In practice that means a riding season that runs comfortably from April into November, which is longer than most of the country and shorter than none of it deserves to be dismissed as.
What Toronto's Cycling Network Actually Looks Like On The Ground
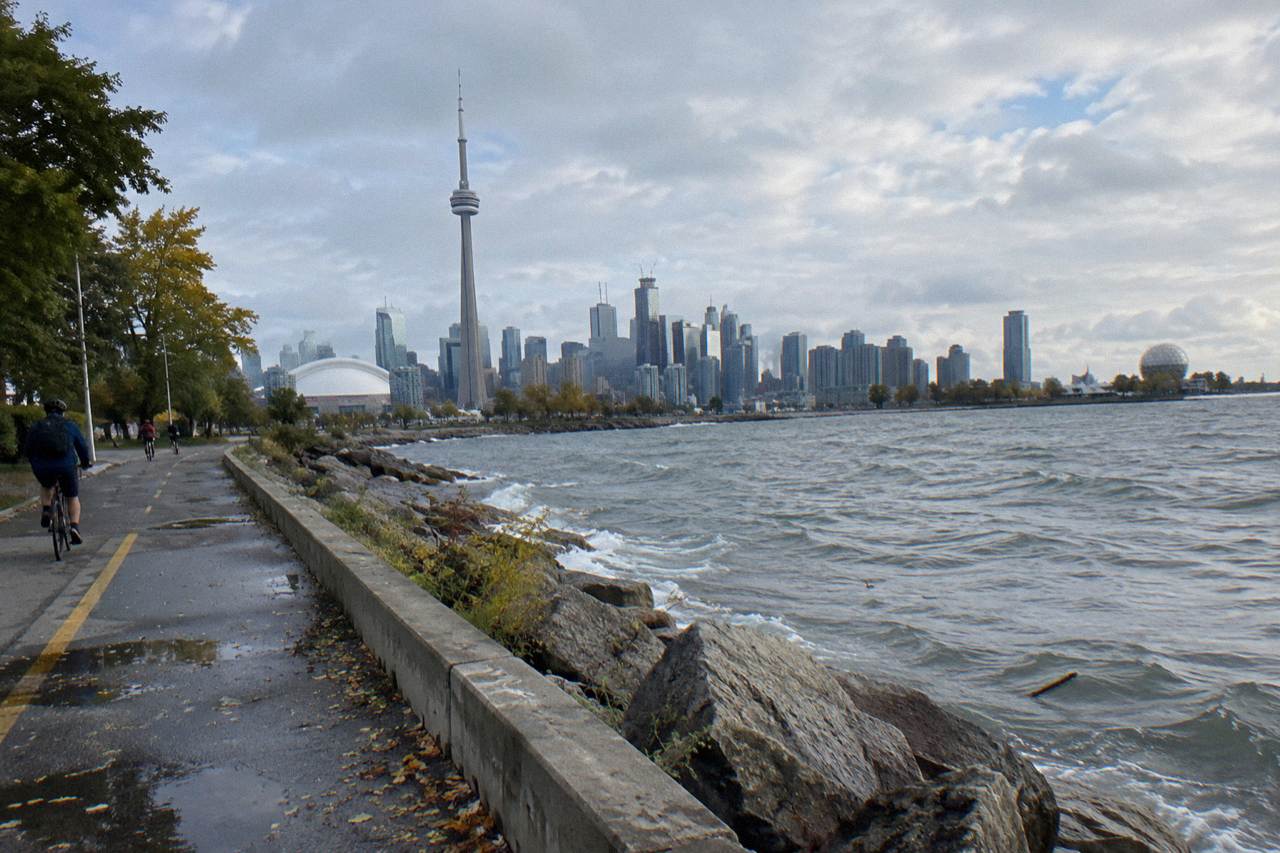
On the ground, Toronto's bike-friendliness concentrates in two places: the waterfront, where the Martin Goodman Trail runs more than 20 km of continuous off-street path from the western to the eastern beaches, and the downtown core, where cycle tracks and painted lanes thread the dense neighbourhoods. Between them sits the car-free Toronto Islands, reachable by ferry with your bike walked on and off.
The Martin Goodman Trail is the spine of the system. The City describes it as part of a network of over 300 km of trails within Toronto, and with its 2019 Unwin Avenue section it completes a 20-plus km route along the waterfront. For a visitor deciding whether Toronto deserves the bike-friendly label, this single trail answers a lot: it is continuous, it is off-street, and it connects neighbourhoods that would otherwise be a series of disconnected segments. It is also under active construction in one spot, because the section on Parliament Street has been closed from 22 April 2026 to 31 December 2026, with a temporary two-way protected lane carrying riders through the Quayside works. Checking current detours before a long waterfront ride is simply good planning.
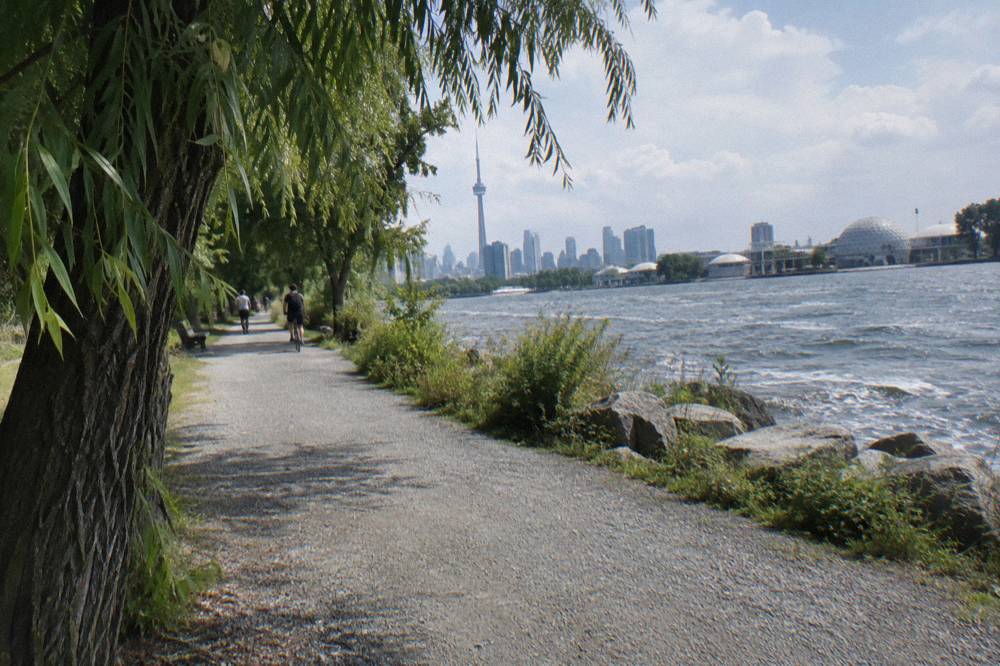
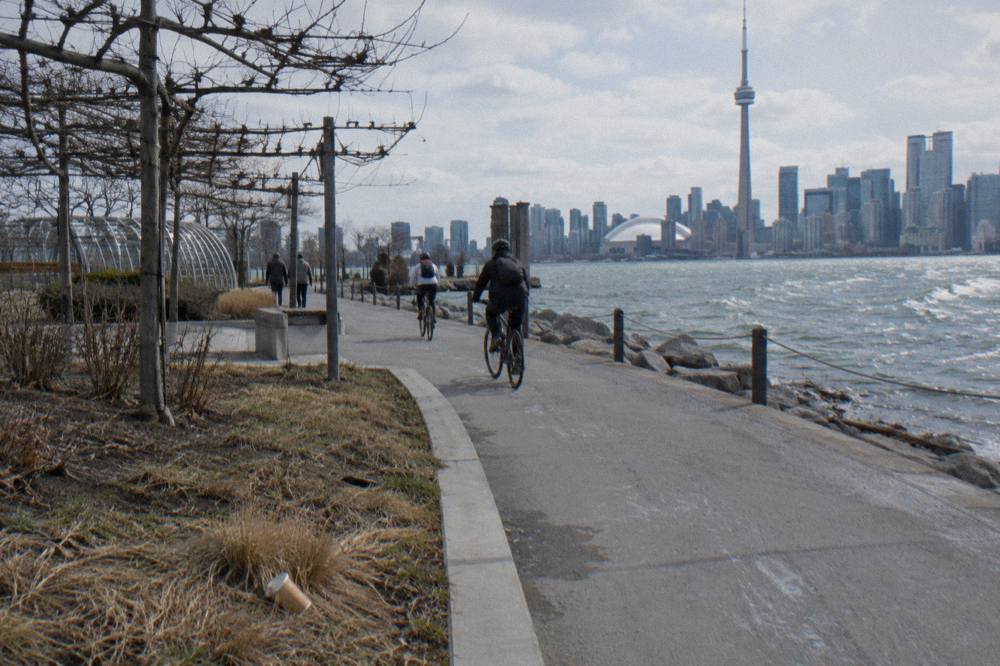
The Islands are the other half of the case. No private vehicles, paved and gravel trails, and a ferry that explicitly welcomes bicycles, with the City asking riders to walk bikes when boarding and disembarking. One verified wrinkle: Bike Share bicycles are not permitted on the ferries, and e-bikes ride at staff discretion, must stay powered off on board, and cannot be charged at the terminal. Larger e-bikes, roughly 40 kg and over, may be directed to the vehicle ferry. The round-trip fares are set in Canadian dollars, and the winter schedule from 14 October 2026 serves Ward's Island only until mid-April 2027, so island riding is a seasonal proposition shaped by the sailing schedule rather than the weather alone.
None of this requires you to ride it alone to judge it. A guided ride is the fastest way to audit a city's bike-friendliness in a single afternoon, because a local operator already knows which segments connect and which are torn up this month. The waterfront and islands guided bicycle tour covers the two strongest parts of the network in one 3.5-hour loop, and the operator's booking page carries the current price and meeting point. If your question is whether the infrastructure feels connected from the saddle rather than from a map, that ride answers it directly.
The rules layer sits on top of the physical network, and Ontario's are unusually clear. E-bike riders must be 16 or older and helmeted, with assisted speed capped at 32 km/h, a motor limit of 500 watts and a maximum bike weight of 120 kg. The two e-bike guided rides available in Toronto are the only electric options among the city's shared guided tours, and both run about 3.5 hours through the downtown neighbourhoods. More detail on the legal side is in the site's guide to Toronto cycling rules, helmets and e-bike law.
How Rankings Get Built, And Why They Disagree
Rankings of bike-friendly cities disagree because they are built from different inputs: some count protected lanes only, some count all infrastructure, some weight survey results on how safe residents feel, and some fold in weather. A city can rank first on one list and mid-table on another in the same year without either list being wrong.
The method problem is not subtle. Imagine two studies published in the same year. One measures kilometres of protected infrastructure per capita, which favours cities that recently built heavily relative to their population. The other measures the share of all trips made by bike, which favours compact cities where destinations are close and transit is already strong. A third might survey residents on perceived safety, which favours cities whose riders are confident enough to answer. All three are legitimate. All three produce different winners, and none of them is the definitive measure of the word "most".
This is why the page you are reading declines to crown a champion. No source in the verified research behind this article establishes a national ranking with a method transparent enough to check, and the site's policy is to print only figures that can be traced to an official count. For guidance on reading the network maps yourself, the site maintains a Toronto bike lanes and bike path map guide built from the same City data.
What the Toronto record does show is direction. The network grew to its December 2025 totals through two decades of incremental additions, Bike Share Toronto planned to add 200 e-bikes, 750 regular bikes and roughly 1,200 solar-powered docking stations in 2026, and the East Don Trail's first phase, a 3.3 km multi-use path, opened in July 2026 linking Don Valley trails to The Meadoway. Set against that, the province removed 1.2 km of protected lanes on Bloor West in October 2026 and has an open request for proposals covering roughly 19 km of major streets, with construction possible from spring 2027. Growth and removal are happening at the same time, which is exactly the condition that makes a single ranking meaningless.
There is also a rider-behaviour signal that rankings rarely capture. On FIFA World Cup match days in summer 2026, the City reported cycling activity around the stadium up 25 to 140 percent above baseline, weather depending. A city where thousands of people reach a major event by bike, in a tournament month that drew visitors from 57 countries, is a city where riding is a normal transport choice rather than a subculture. That is arguably the realest test of bike-friendliness there is, and no index measures it.
When To Ride, Judged By The Numbers
Toronto's riding season, judged by the 1991 to 2020 climate normals, runs roughly April through November: average highs climb from 11.7 C in April to 27.0 C in July and fall back to 14.6 C in October and 8.1 C in November. Precipitation stays in a narrow band all year, between 52.8 and 81.6 mm per month, so no month is reliably dry.
| Month | Average high | Average low | Precipitation | Days with 1 mm or more |
|---|---|---|---|---|
| April | 11.7 C | 3.9 C | 78.0 mm | 9.4 |
| May | 18.8 C | 10.0 C | 76.4 mm | 9.3 |
| June | 24.2 C | 15.3 C | 81.6 mm | 8.4 |
| July | 27.0 C | 18.1 C | 76.5 mm | 8.2 |
| August | 26.1 C | 17.7 C | 71.9 mm | 7.2 |
| September | 22.0 C | 13.8 C | 69.4 mm | 7.7 |
| October | 14.6 C | 7.7 C | 69.1 mm | 8.3 |
| November | 8.1 C | 2.3 C | 70.8 mm | 9.0 |
Two readings of that table matter for planning. First, summer is warm rather than extreme: a July average high of 27.0 C is comfortable riding weather for most people, and the e-bike options exist precisely for riders who want to cover the neighbourhoods without arriving soaked. Second, the shoulder seasons are genuinely usable. October's average high of 14.6 C is fine for a waterfront ride with layers, and late October 2026 even saw a record 22.2 C day at Pearson, though a record is a record, not a plan.
The winter months are a different proposition, with January averaging a high of minus 0.3 C and 64.6 mm of precipitation, and they coincide with the ferry's Ward's-only winter schedule. Winter riding in Toronto happens, on studded tires and cleared priority routes, but it is an enthusiast's game rather than a visitor's. For anyone comparing cities on year-round ridability, the honest statement is that Toronto's normals give it a seven-to-eight-month core season, and the source of any longer or shorter claim should be checked before it is believed.
How To Judge For Yourself In One Afternoon
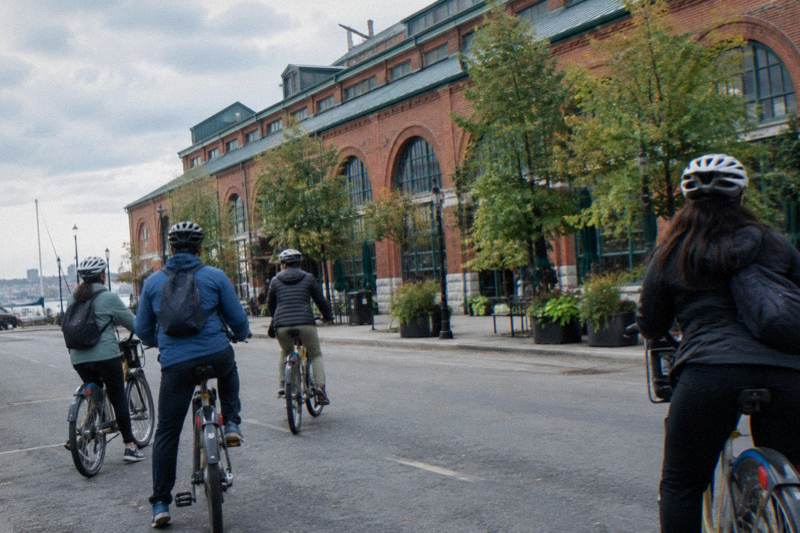
The fastest test of Toronto's bike-friendliness is a guided 3.5-hour ride through the downtown neighbourhoods, where the network is densest: the Heart of Downtown Ride includes snacks, runs on standard bikes, and covers in one loop the lanes, trails and car-free segments that rankings try to reduce to a single number. Check the booking page for price and meeting point.
Riding the network with a guide turns an abstract debate into a direct observation. You notice where the protected lanes are and where the paint runs out. You feel the difference between a sharrow on a quiet street and a cycle track on a busy one. You cross onto the waterfront trail and suddenly the traffic noise drops away. Those are the experiences the rankings are trying to proxy, and a single afternoon on a well-chosen route samples all of them.
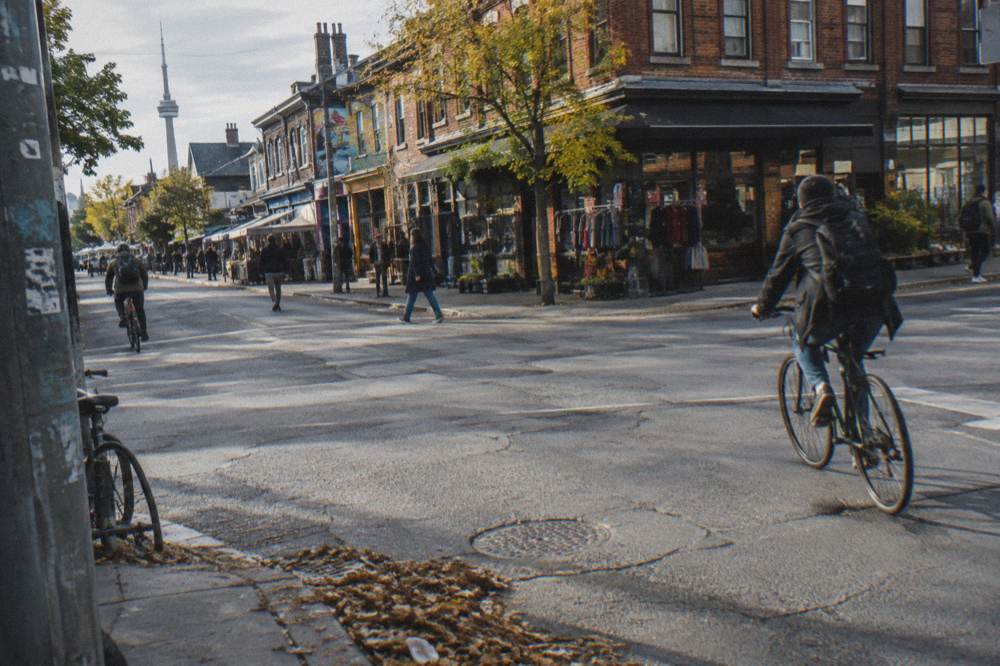
The e-bike alternative suits riders who want the same audit with less effort. The e-bike ride through Toronto's dynamic neighbourhoods covers comparable ground on pedal-assist bikes in about 3.5 hours, and because Ontario caps assisted speed at 32 km/h, the experience stays close to cycling rather than drifting toward scootering. The booking page lists the current price and what is included. Visitors weighing the two formats will find the trade-offs laid out in the site's guide to choosing an e-bike or a regular bike on a Toronto tour.
One more angle deserves a line: the free test. Large parts of what makes Toronto pleasant to ride cost nothing. The Martin Goodman Trail is free to ride, Kensington Market's Pedestrian Sundays run car-free on the last Sunday of each month from May through October, and the Toronto Music Garden hosts free summer concerts on Thursday evenings and Sunday afternoons. A traveller who pairs those with a paid guided ride gets both the infrastructure and the culture of cycling in the city, which together are what the word bike-friendly actually describes. For a fuller list, see the site's roundup of free things to do in Toronto by bike.
Whether any of this earns Toronto the title of Canada's most bike-friendly city is a judgement call the verified data cannot settle, and this site will not pretend otherwise. What the data does settle is that the infrastructure is large, growing in some places and shrinking in others, and rideable for most of the year. The city that wins any given ranking says more about the ranking than about the riding. If you want a verdict, the saddle is the only referee worth trusting, and Bike Tours Toronto exists to help you get into it.
Common Questions About Bike-Friendly Cities In Canada
What Is The Most Bike-Friendly City In Canada?
There is no verified single answer. Rankings use different methods and reach different conclusions, so the winner changes with the measure. What is verifiable is that Toronto's network counted 346 km of on-street cycling infrastructure and 399.3 km of multi-use trails as of December 2025, among the larger totals in the country.
How Many Kilometres Of Bike Lanes Does Toronto Have?
As of December 2025, the City reported 110.1 km of cycle tracks, 143.8 km of painted bicycle lanes and 92.1 km of sharrows, for an on-street total of 346 km, plus 399.3 km of multi-use trails. The mix has shifted in places since, including the October 2026 removal of 1.2 km of protected lanes on Bloor Street West in Etobicoke.
Is Toronto Good For Cycling As A Visitor?
Yes, with seasonal limits. The Martin Goodman Trail offers more than 20 km of continuous waterfront path, the Toronto Islands are car-free and reachable by ferry with a bike, and the downtown core has the densest on-street network. Ontario law requires helmets for riders under 18 and bans sidewalk riding, with an exception for children under 10.
When Is The Best Time Of Year To Cycle In Toronto?
Roughly April through November, based on the 1991 to 2020 climate normals. Average highs run from 11.7 C in April to 27.0 C in July, then fall to 8.1 C in November. Note that the island ferry runs a reduced winter schedule serving Ward's Island only from mid-October to mid-April, which limits island riding regardless of weather.
Can You Take A Bike On The Toronto Island Ferry?
Yes. Bicycles are welcome on board and riders are asked to walk bikes when boarding and disembarking. Bike Share bicycles are not permitted, and e-bikes travel at staff discretion, powered off, with larger e-bikes around 40 kg and over possibly directed to the vehicle ferry. Round-trip fares apply, in Canadian dollars.
Do Rankings Of Bike-Friendly Cities Mean Anything?
They mean something, but not what headlines imply. Each ranking measures a different mix of infrastructure, ridership, safety perception and climate, so a city can top one list and miss another in the same year. Treat them as snapshots of one method, and judge a city by riding it.